
How do you justify investing in an active, high-conviction strategy when a lower-cost ETF or index-tracking fund offers comparable returns? Let the data drive better conversations and better outcomes.
We looked at the universe of investment strategies in developed international and emerging market equities and in examining the risk and return characteristics, found that high-conviction strategies can offer more than you may think.
HERE’S WHAT WE FOUNDThe Return To Normal
2017: Not the norm
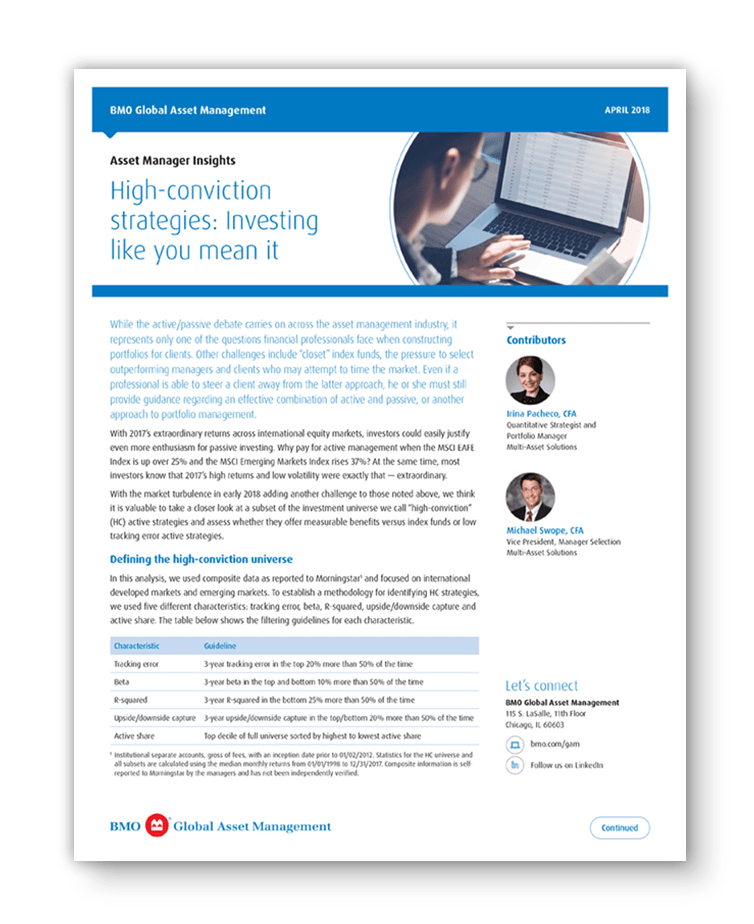
With 2017’s extraordinary returns across international equity markets, investors could easily justify even more enthusiasm for passive investing. But indexers beware; the unusually favorable environment in 2017 is not the norm.
Extraordinary returns and low volatility
Return percentages in 2017
The return to normal
As investors and portfolios readjust to normal levels of risk and return, we think it is valuable to take a closer look at the subset of the investment universe we call “high-conviction” strategies.
Defining high-conviction:
Analysts utilize a range of data and criteria to identify strategies that diverge from broad market benchmarks.
CRITERIA
How to identify high-conviction
In our analysis, we used composite data as reported to Morningstar1 and focused on international developed markets and emerging markets.

Characteristics to define the high-conviction universe:
Tracking error
3-year tracking error in the top 20% more than 50% of the time.
The difference between the performance of a strategy and its benchmark.
Beta
3-year beta in the top and bottom 10% more than 50% of the time
A measure of a strategy’s volatility in relation to the market or a benchmark.
R-squared
3-year R-squared in the bottom 25% more than 50% of the time
A measure of a strategy’s movements that can be explained by movements in a benchmark index.
Up/down capture
3-year upside/downside capture in the top/bottom 20% more than 50% of the time
Evaluates strategy performance against the benchmark in periods when the benchmark return is positive/negative. A 100% ratio shows strategy performance in line with the benchmark.
Active share
Top decile of full universe sorted by highest to lowest active share
A measure of the percentage of stock holdings in a manager’s portfolio that differs from the benchmark index.
Universe
To establish the high-conviction universe, we included composites that appeared in three out of the five groups created by these filtering guidelines.
International developed markets
22/141 strategies qualified as high-conviction
Emerging markets
26/132 strategies qualified as high-conviction
OBSERVATIONS
Risk/return observations
The subset of high-conviction strategies that met our criteria returned both higher returns and lower risk (standard deviation) when compared to the full universe. See how the high-conviction strategies compared to other subsets.
For more high-conviction comparisons, download the full report.
Toggle the tags below to display comparisons on the chart.
Downside risk mitigation


Patience pays off for high-conviction investors.
For those investors with a long-term investment perspective, the story becomes more clear.
How often are high-conviction strategies top-quartile performers?
How do high-conviction strategies respond after underperformance?
Three years after delivering bottom-quartile performance, the probability of delivering top-quartile performance:
How do high-conviction strategies respond after outperformance?
Three years after delivering top-quartile performance, the probability of delivering bottom-quartile performance:
“There’s a lot of emotion that goes into investments, but to have this analysis could allow you to have a tool to show your clients that long-term patience is a virtue.”
Michael Swope, co-author of the report
Listen to the full interview
Improving performance is defined as delivering top-quartile performance three years after delivering bottom-quartile performance; declining performance is defined as delivering bottom-quartile performance three years after delivering top-quartile performance. Past performance is not a guarantee of future results.
PORTFOLIO
Add value in portfolio construction
For clients able to understand and accept some variation in short-term performance, high-conviction strategies offer the opportunity to improve their portfolio. In the full report, we provide a practical application of high-conviction strategies to a portfolio, showing the risk/return benefits of a 50% EFT/50% HC portfolio:

EXPLORE
Download the full research report
Explore our complete analysis of high-conviction managers by downloading the full report. You’ll get:
• Practical application - results from a sample portfolio • More and deeper comparisons of high-conviction vs. non-high-conviction • Additional client talking points
Fill out the form below to download the full report.

1 Institutional separate accounts, gross of fees, with an inception date prior to 01/02/2012. Statistics for the HC universe and all subsets are calculated using the median monthly returns from 01/01/1998 to 12/31/2017. Composite information is self-reported to Morningstar by the managers and has not been independently verified.
Morgan Stanley Capital International Europe, Australasia and Far East Index (EAFE) is a standard unmanaged foreign securities index representing major non-U.S. stock markets, as monitored by Morgan Stanley Capital International (MSCI).
The MSCI Emerging Markets Index is a market capitalization weighted index comprised of over 800 companies representative of the market structure of emerging countries in Europe, Latin America, Africa, Middle East and Asia. Prior to January 1, 2002, the returns of the MSCI Emerging Markets Index were presented before application of withholding taxes.
The S&P 500 Index is a capitalization-weighted index of 500 stocks. The index is designed to measure performance of the broad domestic US economy through changes in the aggregate market value of 500 stocks representing all major industries.
Investments cannot be made in an index.
BMO Global Asset Management is the brand name for various affiliated entities of BMO Financial Group that provide investment management and trust and custody services. Certain of the products and services offered under the brand name BMO Global Asset Management are designed specifically for various categories of investors in a number of different countries and regions and may not be available to all investors. Products and services are only offered to such investors in those countries and regions in accordance with applicable laws and regulations. BMO Financial Group is a service mark of Bank of Montreal (BMO).
All investments involve risk, including the loss of principal.
Foreign investing involves special risks due to factors such as increased volatility, currency fluctuation and political uncertainties.
Investing in emerging markets can be riskier than investing in well-established foreign markets.
This information is not intended to serve as a complete analysis of every material fact regarding any company, industry or security. The opinions expressed here reflect our judgment at this date and are subject to change. Information has been obtained from sources we consider to be reliable, but we cannot guarantee the accuracy. Investors should seek advice regarding the appropriateness of investing in any securities or investment strategies discussed or recommended in this report and should understand that statements regarding future prospects may not be realized. Investment involves risk. Market conditions and trends fluctuate. The value of an investment as well as income associated with investments may rise or fall. Accordingly, investors may receive back less than originally invested.
Investment advisory services in the United States are provided by BMO Asset Management Corp., LGM Investments Limited, BMO Global Asset Management (Asia) Limited, Pyrford International Limited and Taplin, Canida & Habacht, LLC.
This website is for informational purposes only and is not intended to provide a complete description of BMO Global Asset Management's products or services. Past performance is not indicative of future results. It should not be construed as investment advice or relied upon in making an investment decision. Information on this website does not constitute an offer for products or services, or a solicitation of an offer in any jurisdiction in which such solicitation or offer would be unlawful. Products and services can only be offered by appropriate representatives of the respective manager. Notice to residents of the United Kingdom: For the avoidance of any doubt, the information on this website does not constitute an offer for products or services to persons in the United Kingdom.
Please read the Privacy Policy and Legal Disclosures reached through links above for important information.
Investment products are: Not a Deposit — Not FDIC Insured — No Bank Guarantee — May Lose Value.
Copyright© 2018. BMO Financial Corp. All Rights Reserved.
TM/® Trade-marks/registered trade-marks of Bank of Montreal, used under license.